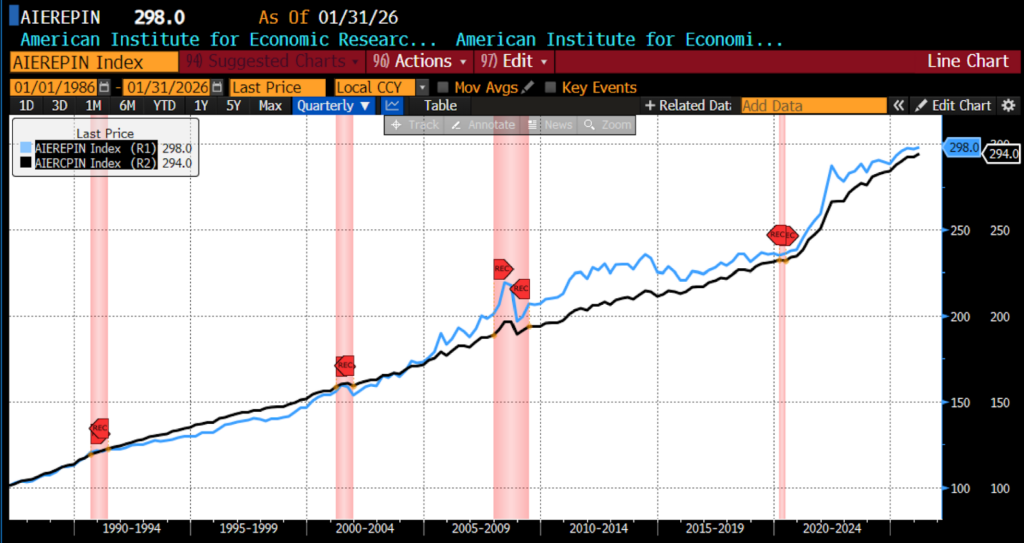
In January 2026 the AIER Everyday Price Index (EPI) rose 0.33 percent to 298.0, starting the year with its largest increase since June 2025. Seventeen of its 24 constituents rose in price in January, with five declining and two unchanged. Pets and pet products, gardening and lawncare services, and housing fuels and utilities saw the largest monthly price increases, while alcoholic beverages at home, personal care products, and intercity transportation saw the largest declines.
AIER Everyday Price Index vs. US Consumer Price Index (NSA, 1987 = 100)
(Source: Bloomberg Finance, LP)
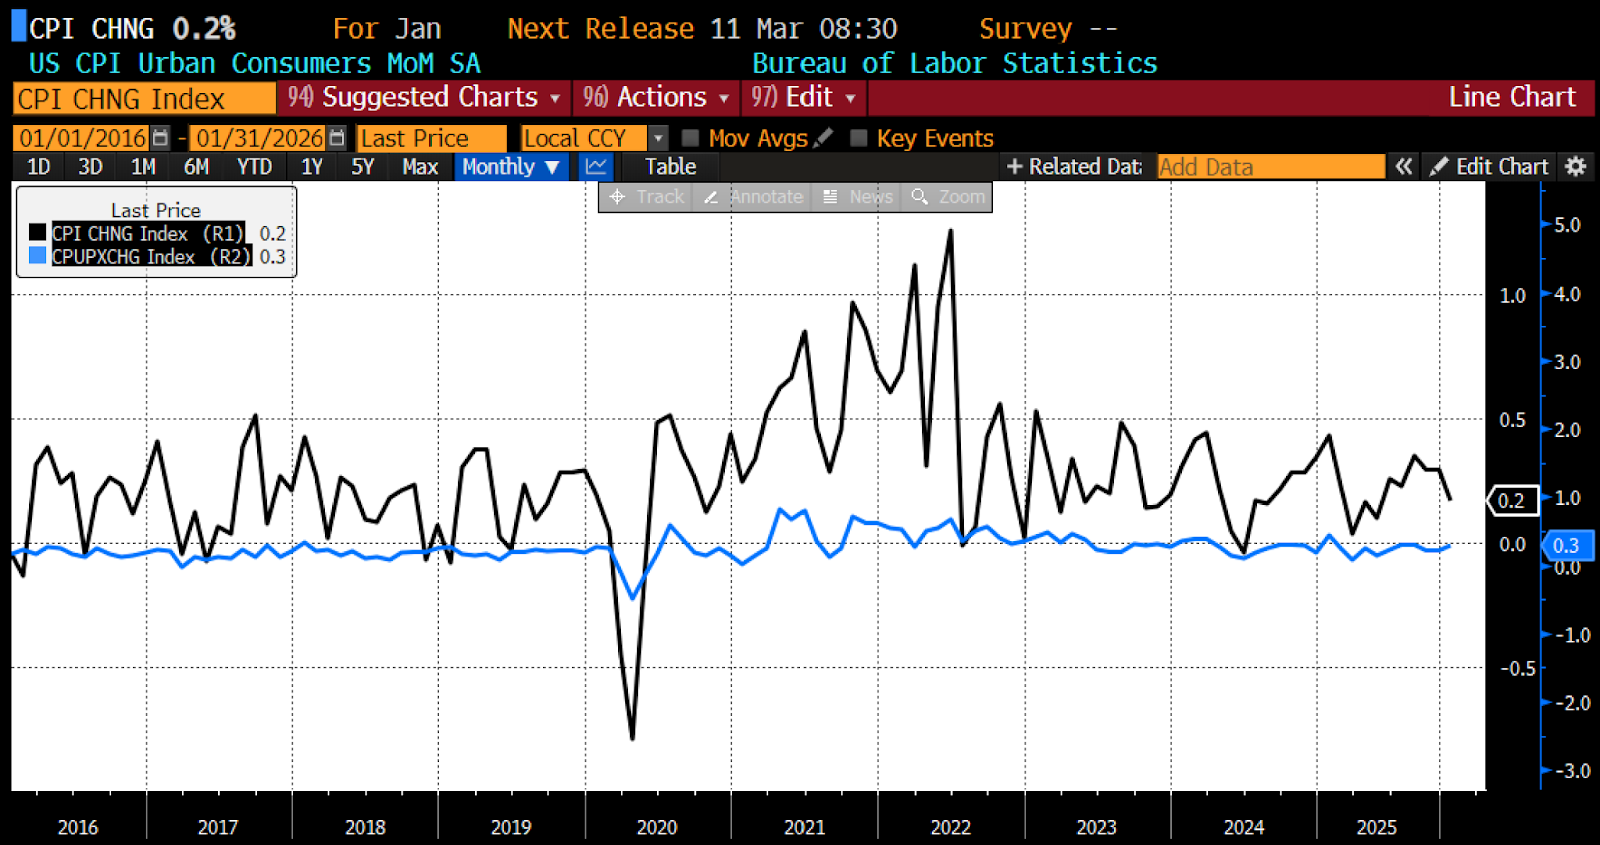
Also on February 13, 2026, the US Bureau of Labor Statistics (BLS) released its January 2026 Consumer Price Index (CPI) data. On the month-over-month side, headline CPI rose 0.2 percent (versus a surveyed 0.3 percent) while core increased the forecast 0.3 percent.
January 2026 US CPI headline and core month-over-month (2016 – present)
(Source: Bloomberg Finance, LP)
Consumer prices in January were driven largely by a moderate rise in core inflation, with the index excluding food and energy increasing 0.3 percent for the month. Price gains were broad-based across services and discretionary categories, including sharp increases in airline fares alongside advances in personal care, recreation, medical care, communication, apparel, and new vehicles. These increases were partly offset by declines in used cars and trucks, household furnishings and operations, and motor vehicle insurance, reflecting ongoing normalization in some durable-goods and insurance-related costs. Within medical care, hospital services and physicians’ services moved higher while prescription drug prices were unchanged, contributing to steady upward pressure in healthcare costs.
Food prices rose 0.2 percent in January, led by gains across most grocery categories, including cereals and bakery products, dairy, meats, nonalcoholic beverages, and fruits and vegetables, while the “other food at home” category declined modestly. Prices for meals away from home edged up 0.1 percent, with increases in limited-service meals offset by flat pricing at full-service establishments. Energy prices, by contrast, fell 1.5 percent over the month, driven primarily by a 3.2 percent decline in gasoline prices and a slight drop in electricity, although natural gas prices increased. Overall, the mix of softer energy costs and firmer core categories left headline inflation shaped by continued resilience in services and selective goods inflation even as energy provided a temporary offset.
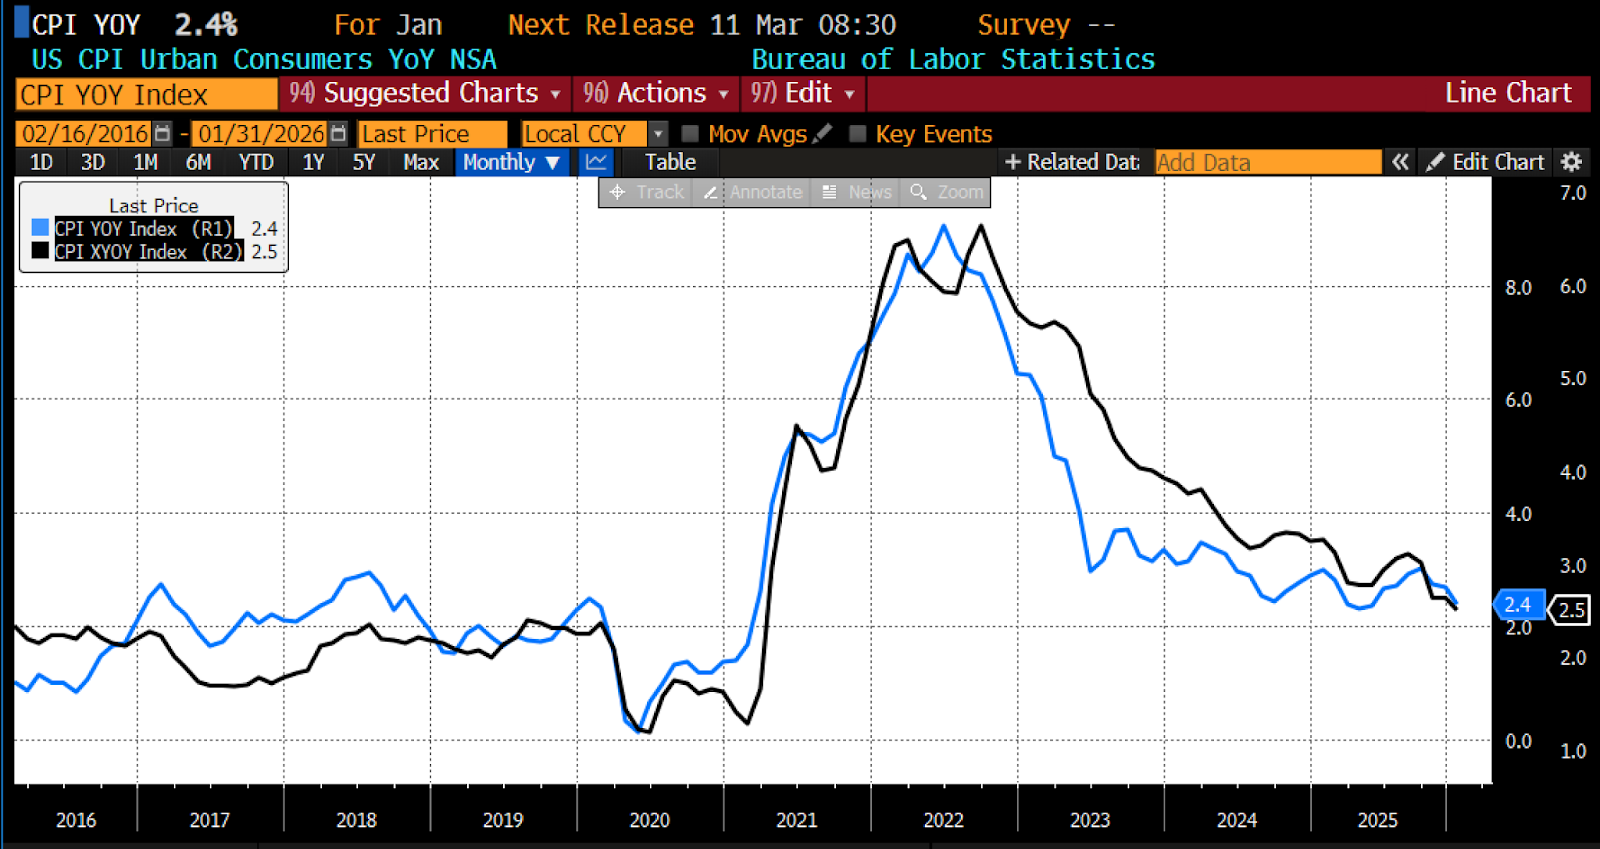
Over the prior 12 months, the headline Consumer Price Indices rose 2.4 percent against an expected 2.5 percent, with core year-over-year rising an expected 2.5 percent from January 2025 to January 2026.
January 2026 US CPI headline and core year-over-year (2016 – present)
(Source: Bloomberg Finance, LP)
Over the 12 months ending in January, food prices continued to firm, with grocery costs rising 2.1 percent on the year as most major categories posted gains. Prices for nonalcoholic beverages led the increase, climbing 4.5 percent, while cereals and bakery products advanced 3.1 percent and meats, poultry, fish, and eggs rose 2.2 percent. The “other food at home” category also increased 2.1 percent, and fruits and vegetables posted a more modest 0.8 percent gain, partially offset by a slight 0.3 percent decline in dairy and related products. Dining out remained a notable source of inflation, with the food away from home index rising 4.0 percent over the year, driven by a 4.7 percent increase in full-service meals and a 3.2 percent rise in limited-service meals.
Energy prices were broadly flat over the year, edging down 0.1 percent overall as a sharp 7.5 percent decline in gasoline prices was largely counterbalanced by sizable increases in electricity and natural gas, which rose 6.3 percent and 9.8 percent respectively. Excluding food and energy, core consumer prices increased 2.5 percent over the past year, with shelter costs advancing 3.0 percent and continuing to anchor underlying inflation. Additional upward pressure came from medical care, household furnishings and operations, recreation, and personal care — the latter posting a notable 5.4 percent gain — even as some goods categories such as used vehicles and certain household items showed signs of cooling.
The January report came in milder than many economists expected — especially for a month that typically runs hot as businesses reset prices at the start of the year. Yet beneath the surface, the inflation story remains uneven. Core goods prices were flat overall, masking a split between rising recreation-related items — such as consumer electronics, sporting goods, and toys — and declines in used vehicles, medical commodities, and some household goods. These crosscurrents reflect several forces at work simultaneously: lingering tariff pass-through in certain goods, AI-driven demand for electronic inputs, regulatory changes holding down medical costs, and fading supply disruptions in groceries. Services inflation, however, continues to run warmer, led by airfares, car rentals, and admission prices for sporting events. Shelter inflation moderated, with both rents and owner-equivalent rents slowing, offering a potential sign that one of the largest drivers of recent inflation is gradually cooling. Notably, prescription drug prices were unchanged — unusual for January — partly due to negotiated Medicare pricing that offset typical annual increases.
Taken together, the report suggests inflation pressures are shifting rather than disappearing. Discretionary services tied to travel, recreation, and wealth-effect spending remain firm, even as goods prices soften and everyday essentials such as energy and groceries show signs of relief. Price increases also became more widespread across categories — a common January phenomenon — but the overall pace was far more restrained than in recent years, hinting that underlying disinflation may dominate in coming months if current trends hold. Financial markets interpreted the data as supportive of potential Federal Reserve rate cuts later this year, though bond-market reactions were mixed given persistent strength in services inflation. For households, the takeaway is that while inflation hasn’t vanished, the early-2026 trend looks less like a renewed surge and more like a gradual cooling — with pockets of stubborn price growth that policymakers will continue to watch closely.

